Visualization of Cultural Heterogeneity
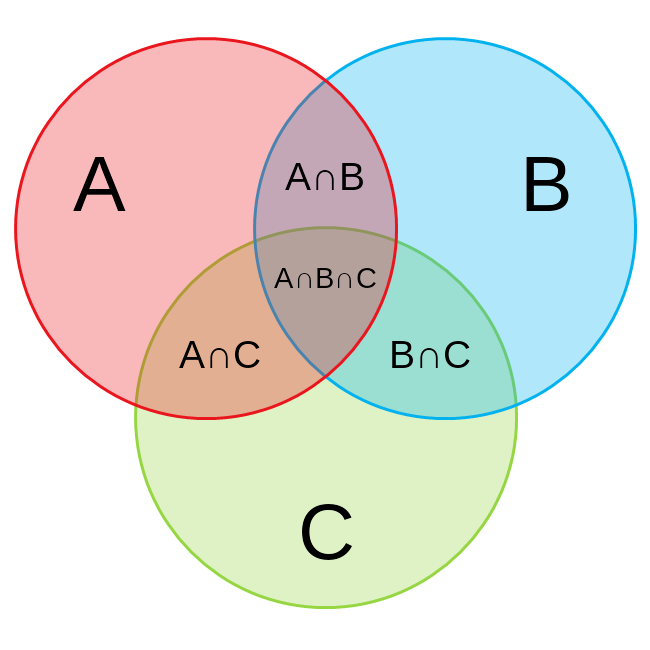
I developed a tool for Professor Glenn Carroll, at Stanford University’s Graduate School of Business, that will allow him to evaluate organizational cultural heterogeneity. The Venn diagram tool I developed is a client-side tool written in Javascript, jQuery, AJAX, D3, HTML, and CSS. The tool ingests an excel file with unlimited columns (sets) and nearly instantaneously renders a Venn diagram based on the three sets with the highest means. The second section allows users to choose the three sets they wish to execute manually.