Discussion of Opportunity Zones
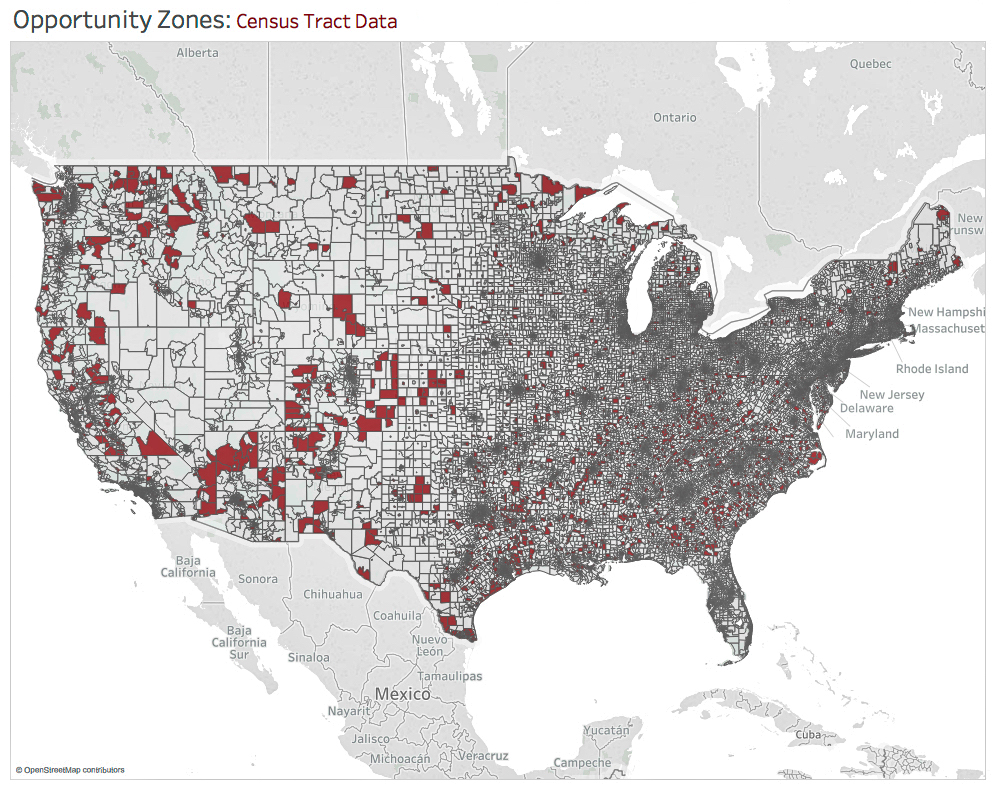
I was asked by Stanford Univesity Professor Rebecca Lester to build a Tableau based tool that would aggregate Opportunity Zones, which were defined in the “Tax Cuts and Jobs Act” of 2017. Challenges with this project were mainly around the limitations of Tableau not supporting U.S. Census tract data. Using python, I developed a polygon shapefile of all U.S. Census Tracts, a shapefile representing nearly seven million data points. After getting Tableau to construct the track polygons, I easily overlay the Opportunity Zone information into an interactive map.