Data Visualization With Pandas
 Python is one of the most popular programming languages for data analysis and visualization, and the Pandas library is one of the most widely used tools for manipulating and analyzing data in Python. In this blog post, we'll take a closer look at Pandas and how to use it to create visualizations in Matplotlib.
Pandas is a powerful library that provides data structures for efficiently storing and manipulating large datasets. It provides a number of data structures, including Series (1-dimensional) and DataFrame (2-dimensional), that make it easy to handle and manipulate data in Python. Pandas also provides a variety of functions for cleaning, transforming, and analyzing data.
To use Pandas, you first need to install it. You can do this by running the following command in your terminal or command prompt:
pip install pandasOnce you have Pandas installed, you can start working with data. You can load data from a variety of sources, including CSV files, Excel files, and SQL databases. Here’s an example of how to load data from a CSV file:
import pandas as pd

# Load data from a CSV file
data = pd.read_csv('data.csv')

# Display the first few rows of the data
print(data.head())
-- Downlaod the raw CSV for your practice here --
This code will load the data from the file ‘data.csv’ into a Pandas DataFrame and display the first few rows of the data using the head() function.
Once you have loaded your data into a Pandas DataFrame, you can start manipulating and analyzing it. For example, you can select specific columns, filter rows based on certain criteria, and calculate summary statistics.
To create visualizations in Matplotlib, you can use the Pandas plot() function, which provides a simple interface for creating a variety of plots, including line plots, scatter plots, and bar charts. Here’s an example of how to create a line plot using the plot() function:
import pandas as pd
import matplotlib.pyplot as plt
# Load data from a CSV file
data = pd.read_csv('data.csv')
# Create a line plot of the data
data.plot(kind='line', x='Year', y='Sales')
# Add a title and labels for the x and y axes
plt.title('Sales Over Time')
plt.xlabel('Year')
plt.ylabel('Sales in Millions $')
# Show the plot
plt.show()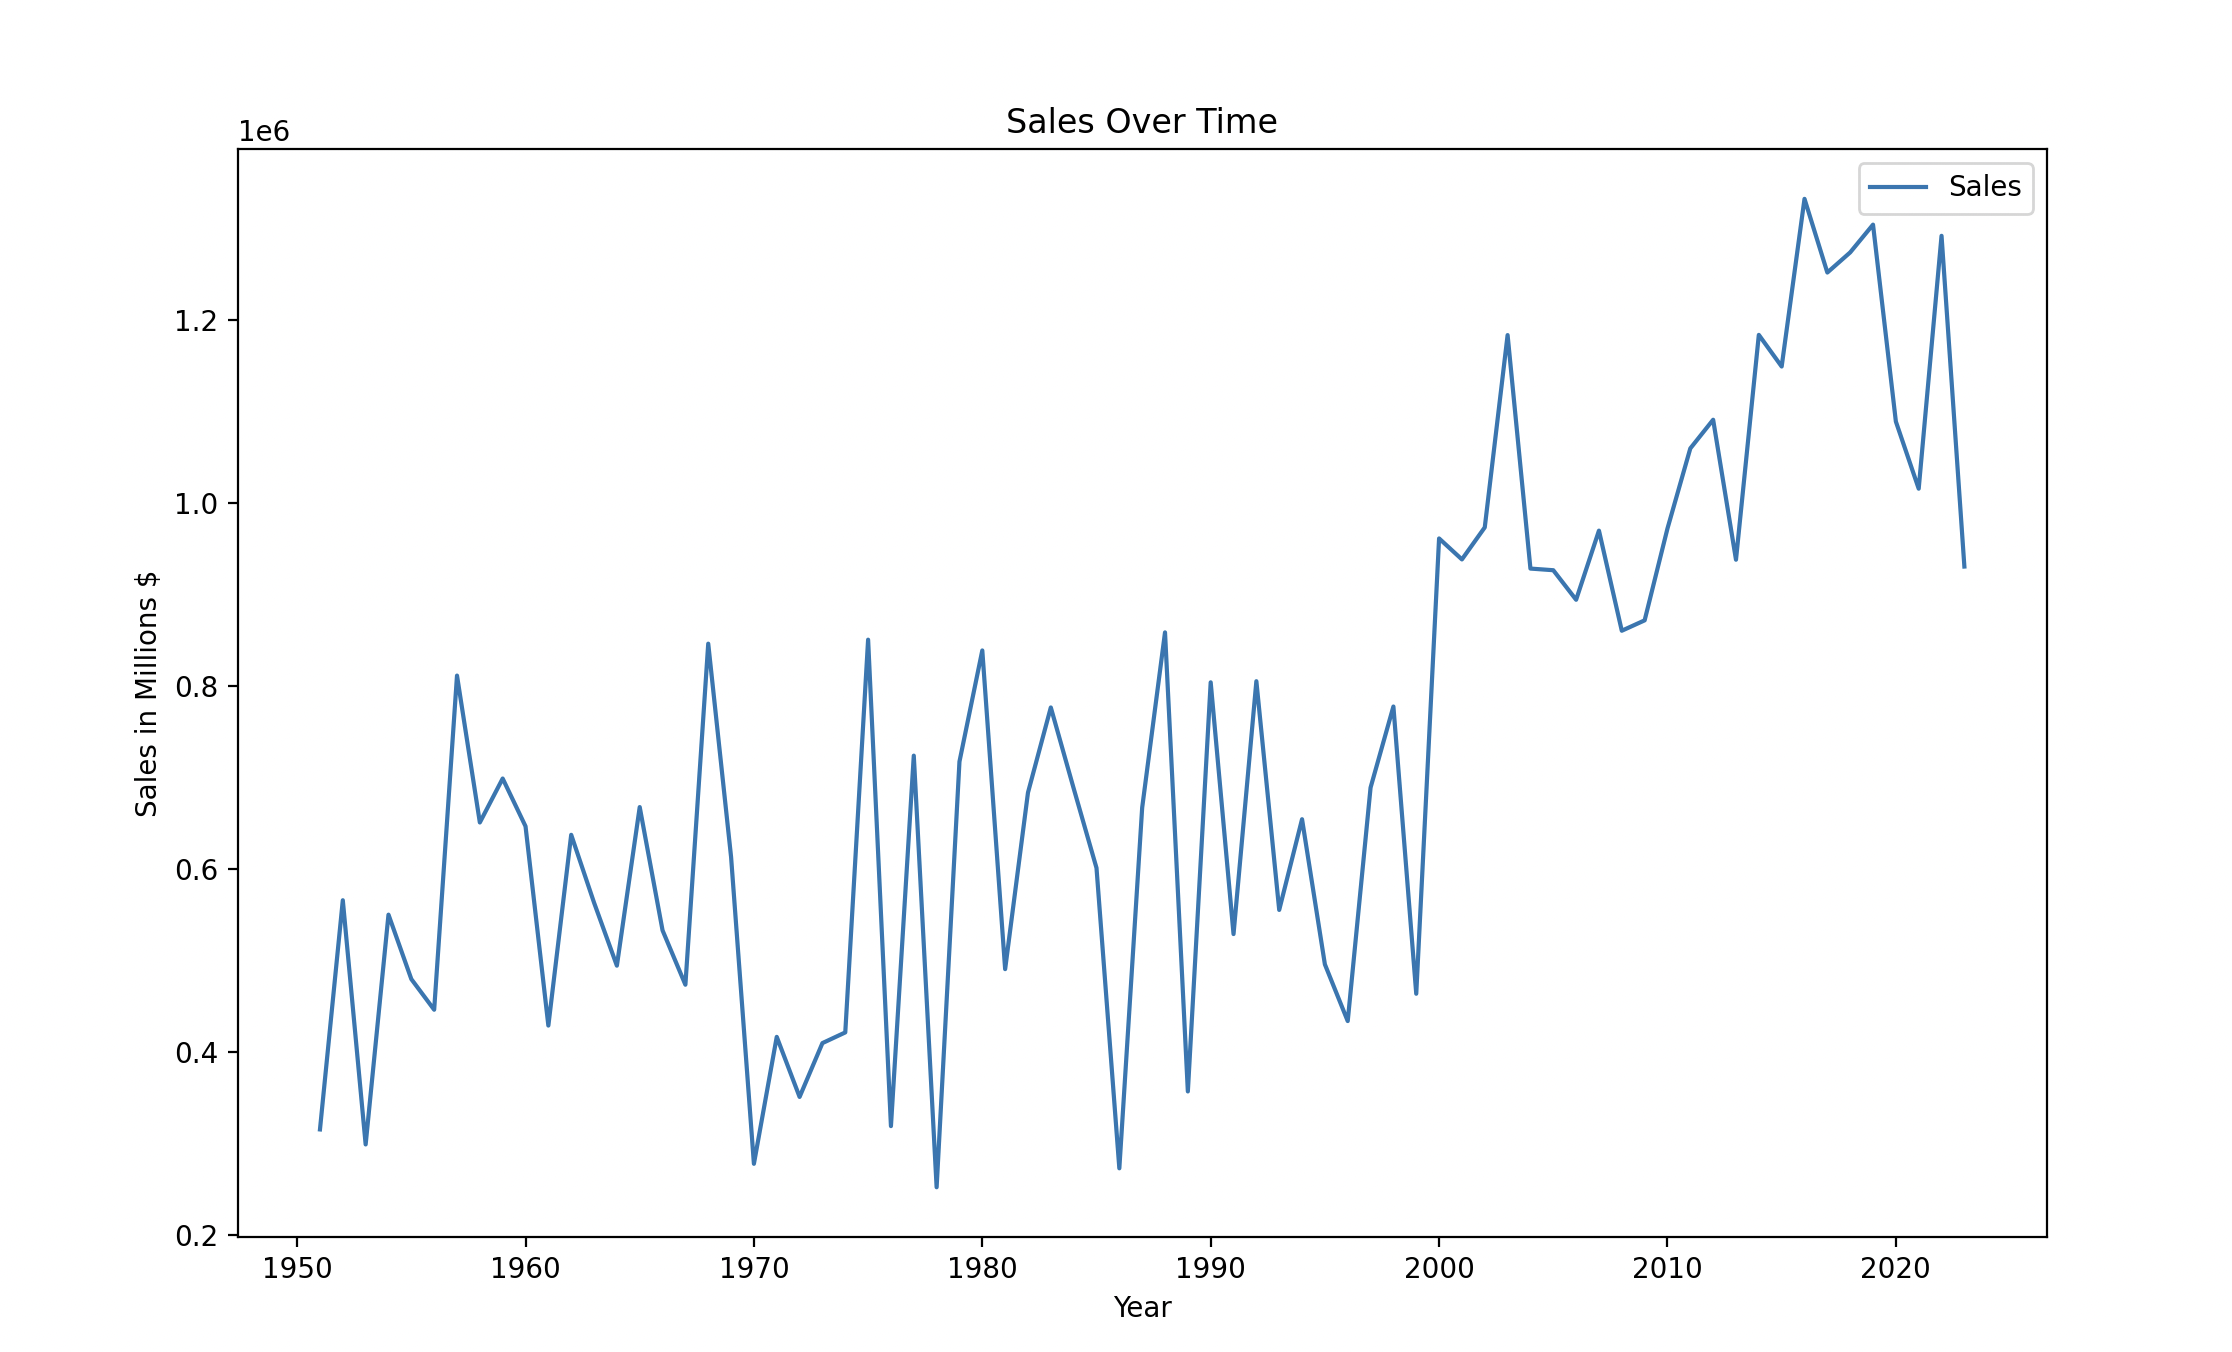 In this example, we first load the data from a CSV file using Pandas. We then create a line plot of the data using the plot() function, specifying the x and y columns we want to plot. Finally, we add a title and labels for the x and y axes using Matplotlib functions and show the plot using the show() function.
Pandas is a powerful and flexible library for working with data in Python, and Matplotlib provides a wide range of options for creating visualizations from Pandas data. With these tools, you can easily analyze and visualize large datasets to gain insights and communicate your findings to others.